

The Development of the Emergency Coastal Flooding Decision Support System
Tim Webster, David Kristiansen, Nathan Crowell, Jesse Siegel, Charity Robicheau, Kevin McGuigan, Matt Roscoe
Applied Geomatics Research Group (AGRG)Nova Scotia Community College (NSCC)
Middleton, NS
Executive Summary
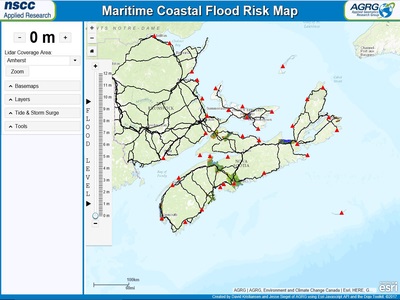
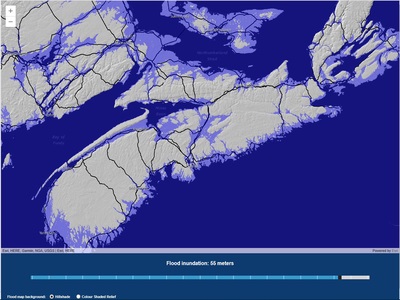
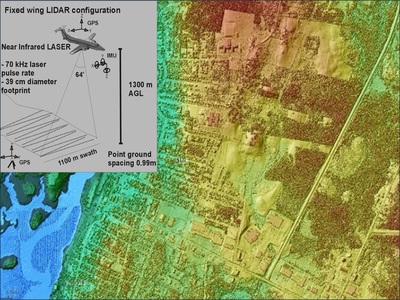
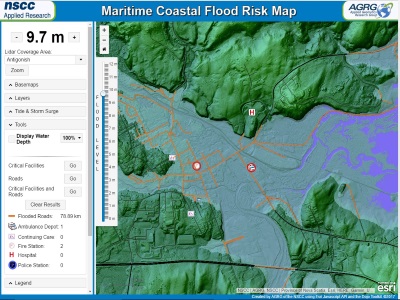
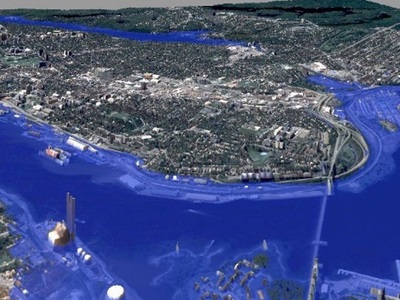
The Applied Geomatics Research Group of the Nova Scotia Community College (NSCC) developed a web-based Emergency Coastal Flooding Decision Support System to present coastal flood risk from storm surges and long term sea-level rise in the Maritimes. The project was funded by the Canadian Safety and Security Program, a federally-funded program led by Defence Research and Development Canada’s Centre for Security Science (DRDC CSS), in partnership with Public Safety Canada and was locally managed by the Nova Scotia Department of Natural Resources, Mineral Resources Branch. The web-based mapping system uses existing high-resolution lidar elevation surveys of coastal areas where flood risk maps have been developed. AGRG has been developing flood risk maps from lidar elevation models for the last decade and this tool finally allows these maps to be accessed by Emergency Management Officials (EMO) and other government officials when a storm surge is predicted or for assessing risk to long term sea-level rise. Other partners include Environment and Climate Change Canada who provide the 10-day storm surge predictions based on DalCoast, which was developed at Dalhousie University, for several coastal communities in the Maritimes. The system integrates the predicted surge water levels with predicted tide levels obtained from the Department of Fisheries and Oceans to produce total water levels (tide + surge). These water level elevations are referenced to what is known as chart datum (tide tables), typically representing the elevation of the lowest possible tide which changes from harbor to harbor, and are converted to a common reference datum that is used for topographic maps and the lidar elevations and flood layers. Once the total water elevation is calculated and selected, the system retrieves the corresponding flood layer and displays it over the lidar shaded relief map, or other background imagery so officials can see what areas may be flooded. The prediction does not account for waves and wave run-up so the user may want to add an additional 0.5 – 1.5 m to the total water level prediction. This can be accomplished by using the vertical slider bar to change the flood level manually. This application also allows any flood level up to 12 m to be selected, so one can look at vulnerable areas in the future considering different relative sea-level rise predictions. Other spatial analysis tools include the ability to display and query the flood depth and to identify flooded critical infrastructure and roads.
The Development Team at NSCC-AGRG:
Dr. Tim Webster – Principal Investigator – project conception and general design; David Kristiansen – Lead Web-Developer; Nathan Crowell – Lidar and Flood layer development; Jesse Siegel – GIS & Web-Developer; Charity Robicheau - GIS, Testing and Documentation; Kevin McGuigan & Matt Roscoe -Tsunami Web-Developers.